Christmas Ecommerce Best Practices [Part 2]

Welcome to the second article of our series about Ecommerce best practices for Christmas. In this series, we focus on providing recommendations on which digital marketing tools and practices to leverage for this holiday season. All our recommendations follow our P.A.C.E methodology which we use for our own digital marketing audits and digital roadmaps, and will be presented according to the four sections that make up our P.A.C.E model: Promote, Analyze, Convert and Engage.
In this week’s article about the Ecommerce best practices for Christmas, we will cover digital marketing recommendations that fall under the Analyze section. Specifically, what metrics to look after and which analytics tool to use in order to track and improve your Christmas campaign's effectiveness.
We have also covered the three additional sections of the P.A.C.E. model:
- Promote: Ecommerce Best Practices for Christmas [Part 1]
- Convert: Ecommerce Best Practices for Christmas [Part 3]
- Engage: Ecommerce Best Practices for Christmas [Part 4]
We will start with a few recommendations on how you should use Google Analytics:
-
Tag your campaigns
Tagging the URLs used for all your digital marketing campaigns is mandatory to be able to quickly and easily analyze your campaigns performance in Google Analytics, and should be done all year long. That being said, if you are not currently tagging your campaigns, it’s not too late to start. So how does it work?
Let’s say that I want to promote the first article of this series Ecommerce Best Practices [Part 1] using our December newsletter.
The URL of the article is the following: http://www.smartt.com/insights/christmas-ecommerce-best-practices-part1
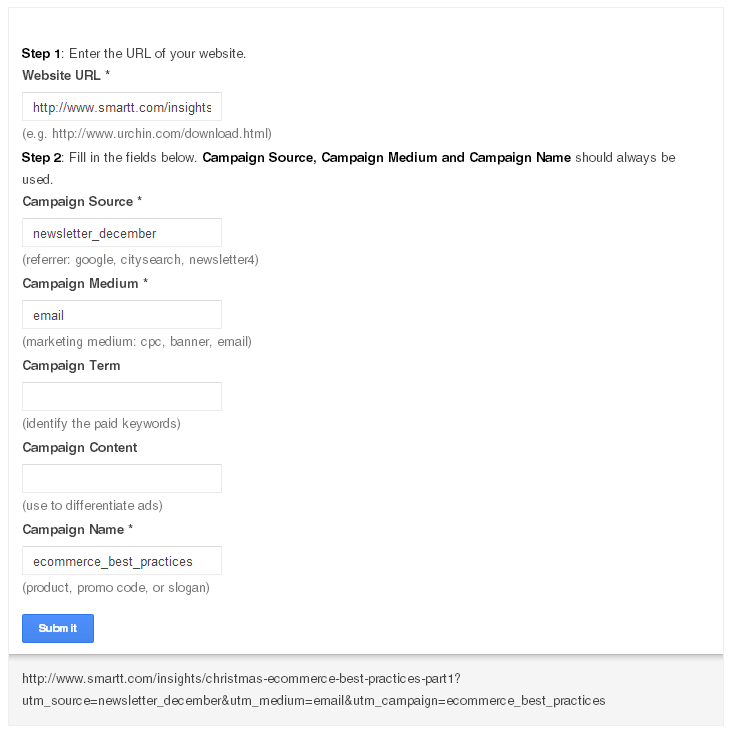
I want to add specific tracking code to this URL to let Analytics know how visitors got to our website, such as the traffic source, medium and the campaign associated. The tagged URL would look like this: http://www.smartt.com/insights/christmas-ecommerce-best-practices-part1?utm_source=newsletter_december&utm_medium=email&utm_campaign=ecommerce_best_practices
If you are tagging an URL used in your Google Adwords campaigns, additional options are available such as “Campaign Term” to identify the paid keywords and “Campaign Content” used to differentiate ads.Your URL can be easily tagged using the Google’s URL Builder as seen below:
You can see how many people clicked the tagged link in Google Analytics by going to Standard Reports > Acquisition > Campaigns: -
Analyze your website’s most popular queries
Once you have tagged all the URLs used in your digital marketing activities, you will know how your visitors get to your website in a precise way. Now you need to know what your visitors are looking for on your website, and one of the easiest ways to do so is to analyze your website’s most popular queries, i.e. what are your visitors searching in your website using the site search function.
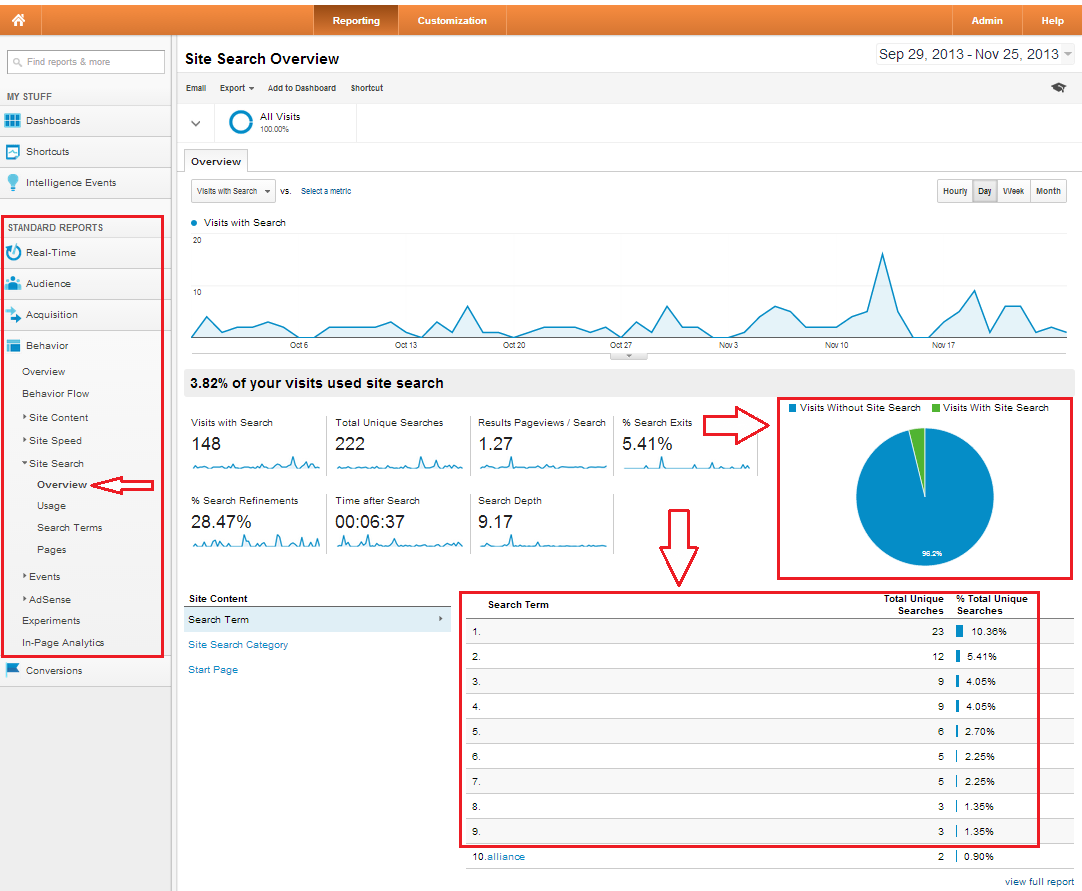
To access your site searches, simple go to Standard Reports > Behavior > Site Search > Overview. This will give you a pretty good summary of the site search usage as seen below:
On the screen above, look at the following information:
a. The most popular search terms. They are a reflection of what your visitors are looking for on your website. If the most popular search terms are for products your website sells, you should place these products in a more prominent way, ideally on your homepage. These popular products can also be used in promotions, or as prizes in contests.
b. The pie chart showing the percentage of visitors who use the site search. This gives you several valuable insights:
- Helps you determine how simple it is for your visitors to find what they are looking for. For example, if you navigation is confusing and too detailed, your visitors might be confused and rely on the search function, whereas if your navigation is simple and natural enough to use, they might find what they want without performing a search. Keep in mind though that some visitors will not bother searching and will directly use the site search, so this information is to use with precaution.
- Helps you determine the value of the most popular search terms. For example, let’s say 50% of your visitors use the site search, and the most popular search term is “iPad Air”, accounting for 60% of all searches. It is safe to assume that the “iPad Air” is very popular product amongst your visitors as the search volume is important.
-
Analyze your visitors’ languages
Your website’s content, as well as your advertisements and collaterals, should be tailored to the major groups of your customers. If you happen to receive a lot of visits from visitors speaking another language than English, you should consider adapting your messaging to them.
If you are a Canadian retailer, keep track of the French speaking visitors, as the searches for “Idée cadeau de Noel” reaches 25 to 50% of the overall volume of searches for “Christmas gift idea” as seen below:
In the U.S., although Spanish is the first language for 12.4% of the population, the search volume for “Idea regales de navidad” is too small to be compared with “Christmas gift ideas”, as you can see below:
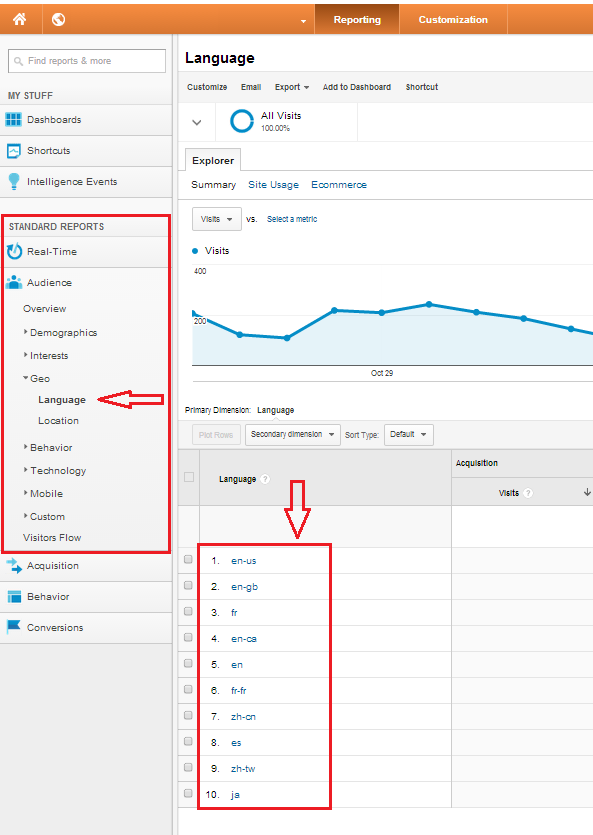
To identify the major languages of your visitors in Google Analytics, go to Standard Reports > Audience > Geo > Language as shown in the example below:
-
Leverage your Conversion Goals to Identify Drop-Offs
Setting up relevant conversion goals is one of the most important tasks when it comes to analyzing the ROI of any digital marketing activities leveraging your website. They allow you to keep track of the conversion, i.e. the visitors’ completion of the established key objectives. If you are an online retailer, your most important goal would be a completed transaction.
Some conversion goals might be specific to the business model and the structure of the website, but here is a small sample of the conversion goals we always recommend:- Contact form completed (with steps such as visit to contact page, contact form initiated, etc.)
- Newsletter signup
- Transaction completed
If you haven’t used any conversion goals in the past, here is a quick presentation video:
The Google Analytics Youtube channel has also published a helpful tutorial on how to setup the conversion goals:
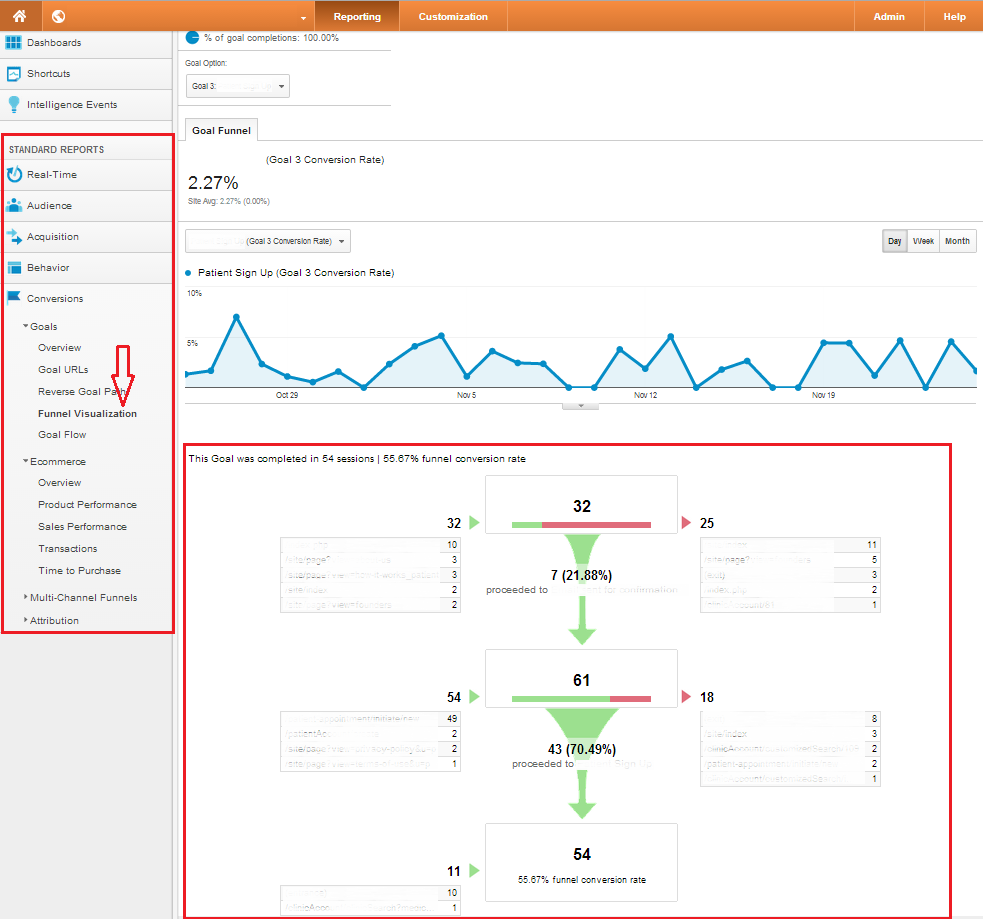
Once you have your conversion goals setup and have some data available, you can start planning the optimization of your “conversion funnel”. On the screen below, you can see an example of a conversion funnel, i.e. the steps necessary to complete the conversion.
Each step of the funnel represents a page considered necessary to complete the conversion. For each step, Analytics displays the entrances and exits, i.e. how many people entered the funnel at that step, and how many dropped off. The drop offs are what you want to act on since people are leaving before they complete the action you want them to.
The example above shows a 3 step conversion funnel. As you can see, 32 visitors enter the first page and 25 leave before going to the 2nd page of the funnel, which means only 21.88% proceeded to go to the 2nd step. On the other hand, 70.49% of the visitors of the 2nd page went to the 3rd one. This shows us that the first page accounts for the majority of the drop offs for that conversion goal, so you will act on the first page in priority in order to reduce the percentage of drop offs. A common way of improving the conversion rate is to use conversion testing tools and to setup conversion testing experiments, we will cover this topic in the third article of this series.
-
Analyze your Christmas Content Performance
In last week article of our series of Ecommerce Best Practices for Christmas, we talked about the importance of adapting your search engine optimization (SEO) to the Christmas season. One of the recommendation provided included creating Christmas-related content to get traffic for popular queries such as “popular gift for Christmas”.
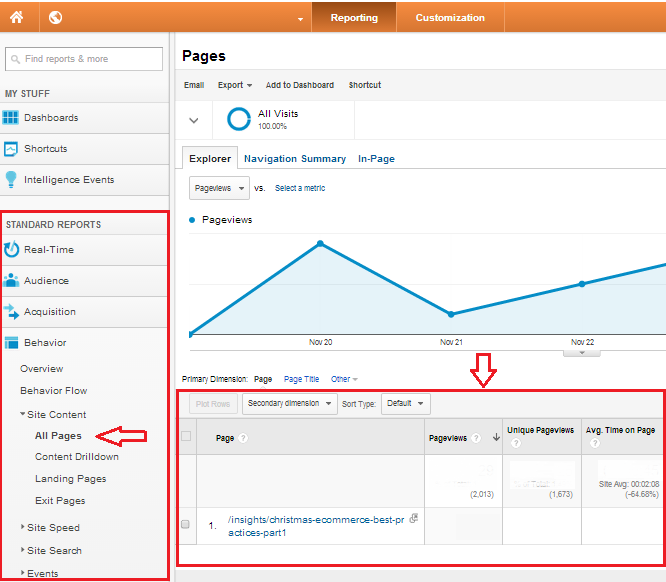
Now that you have created Christmas-related content, you need to analyze the performance of each one of them, i.e. how much traffic did they generate. To do so, in Google Analytics go to Standard Reports > Behavior > Site Content > All Pages and identify the number of Pageviews, as seen below:
Checking the amount of Pageviews generated by each one of the Christmas-related content created allows you to identify the most effective type of content in generating traffic. Focus on this type of content in the future.
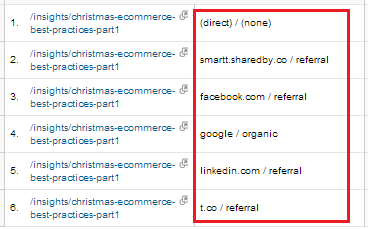
The next step is to use the Secondary Dimension Acquisition > Source / Medium to identify the source of traffic that accounts for the most traffic. As for the content type, focus your attention to the most effective medium.Below, an example of the Source / Medium Secondary Dimension:
The second part of this article focuses on the usage of analysis of your social media activities and promotion. -
Optimize the Time of your Social Media Activities
Optimizing the time to post your social media content is important to ensure the maximal audience is going to see it. There are several ways of doing it that can be specific to each social media channel.
For Twitter, you can:
- Measure the engagement of your previous tweets, and identify the times that got the most engagement. You will want to look at metrics such as the number of retweets, favorites, or the traffic generated by these tweets.
- Measure the engagement of the previous tweets of your competitors.
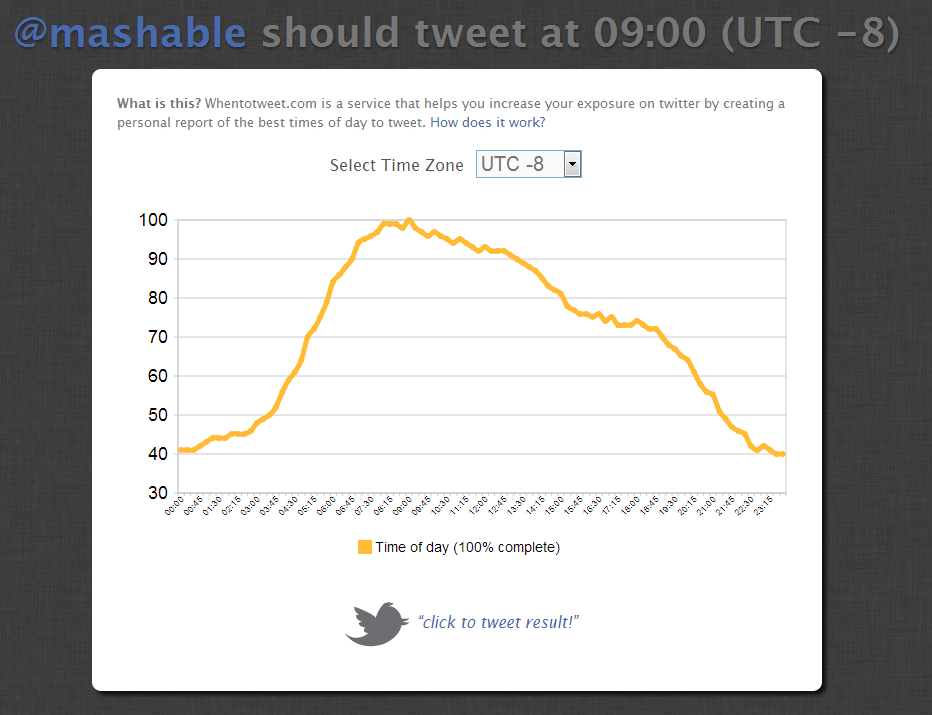
- Use tools to automate this analysis. Beware that those tools often have a cost, such as When to Tweet which let you get a graph of your followers activity time, as seen below for Mashable:
For Facebook, just go to the Page Insights section, then Post. You will see the “When Your Fans Are Online” chart that highlights the best days and times to post content:
-
Optimize your Tweets for Engagement
A 2012 study conducted by Buddy Media and referenced on Twitter for Business best practice page revealed that tweets between 71 and 100 characters get an average 17% more engagement than longer tweets. This allows your followers to either retweet it to a specific person by mentioning their twitter name, or to express their own opinion. Keep that in mind when posting content on Twitter that you want your audience to share.
A simple way of reducing the length of your tweets is to shorten your links, using a service such as bitly. Below, an example of a link shorted:
Original link: http://www.smartt.com/insights/christmas-ecommerce-best-practices-part1
Shortened link: http://bit.ly/1bJ1npD
-
Listen to Your Customers’ Opinion & Feedback
We highly recommend using tools such as Hootsuite or Sproutsocial to “listen” to what your customers are saying about you. As you are likely advertising about products or offers, your customers might express their opinion, you should therefore track:
- Your brand name(s)
- Your product and/or services names
- Your campaigns & offers names
- Any specific hashtag that you could be using for your Christmas campaign
Based on the feedback that you receive from your customers, you can tailor the content of your advertisements & promotions to better address their needs, as well as quickly react to any potential negative comments.
-
Reach Out to Your Industry’s Influencers
It is widely recognized that word-of-mouth is much more efficient than advertising in converting prospects to clients. One of the easiest ways to leverage that word-of-mouth is to get in touch with your industry influencers who have a respected opinion amongst your target audience.
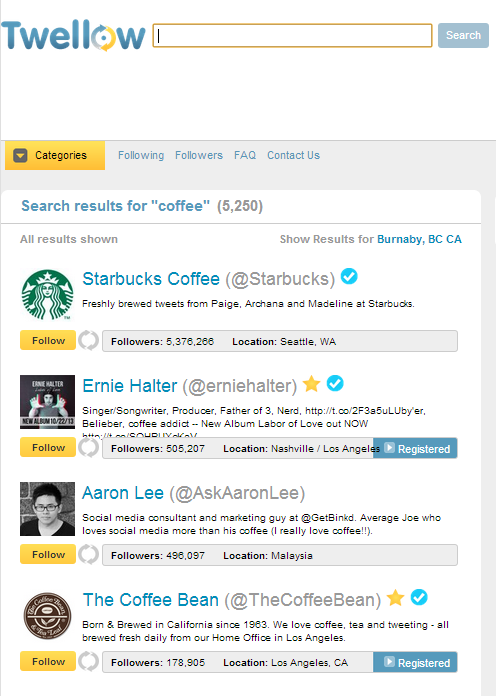
A simple way of indentifying your industry influencers is to use tools such as Twellow, which lets you search for influencers by keywords. You can then get in touch with them and determine whether they are willing to share a good word about your products.Below, a screenshot of Twellow in use for a search of the keyword “coffee”:
As you can see, Twellow not only shows individual influencers, but also the most popular brand accounts related to the query. Take a look at what the popular brands are doing for inspiration.
If you follow these recommendations and combine them with your other digital marketing activities as covered in our P.A.C.E model, you will see measurable improvements in your Christmas campaign.
This concludes our second article of our series on the Ecommerce best practices for Christmas. Don't forget to check the three additional sections of the P.A.C.E. model:
- Promote: Ecommerce Best Practices for Christmas [Part 1]
- Convert: Ecommerce Best Practices for Christmas [Part 3]
- Engage: Ecommerce Best Practices for Christmas [Part 4]
If you want to hear more about these recommendations or get information on how we can help you with your Christmas campaign, get in touch with us through our contact page.
In the meantime, we would love to hear about what practices you plan on using for Christmas, in the comment section below, or on our Facebook and Twitter pages.
